
House Stats: Real-Time UK Housing Market Analysis
For my Computer Science NEA, I set out to tackle a problem that frustrated me: despite the UK housing market being one of the most-analysed sectors in the economy, the public data is practically unusable for anyone who isn’t a data scientist or an investment firm. The Land Registry releases monthly CSVs with millions of transactions—but they’re difficult to visualise, painfully slow to process, and impossible to explore interactively.
So I built House Stats, a full-stack web platform for analysing UK house prices in real time.
System Overview
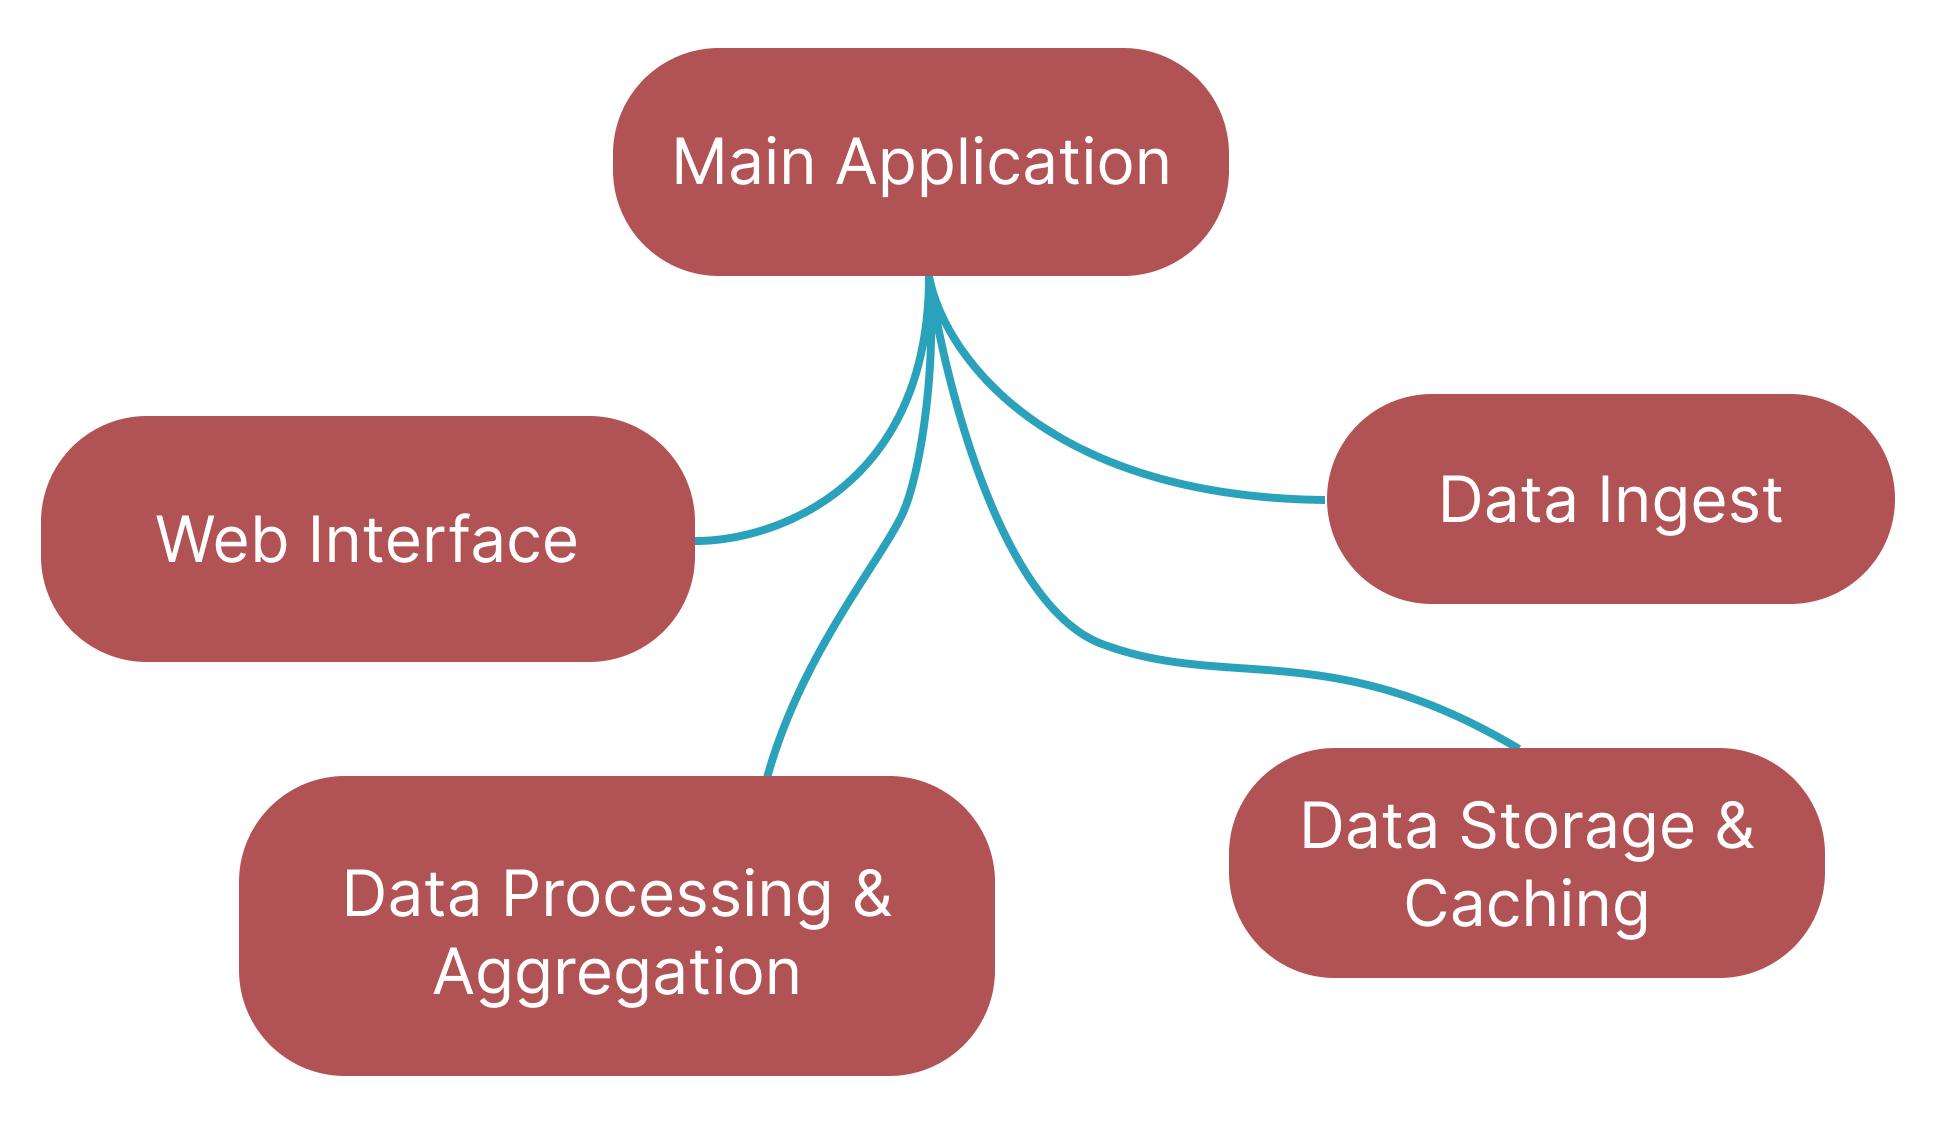
1. Data Ingest
- A Golang + Python pipeline downloads the latest Price Paid Data from the Land Registry every month.
- It validates, parses, and uploads millions of transactions to a PostgreSQL database using a Kafka message queue and asynchronous workers.
- Updates are applied automatically (insert, amend, delete) to keep the dataset current with minimal downtime.
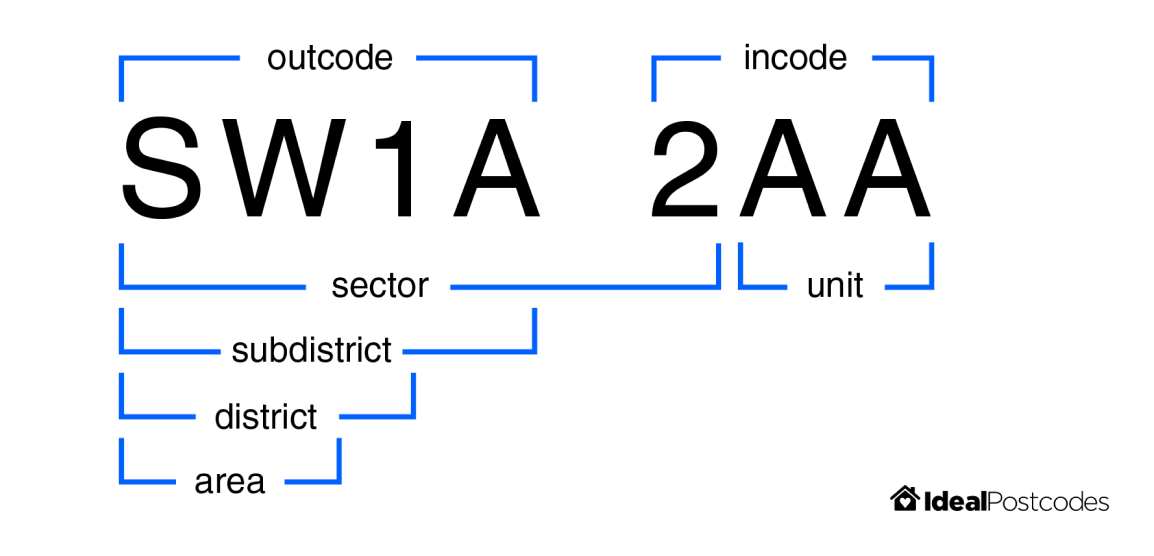
- Parses postcodes into it’s constituent parts for grouping and searching
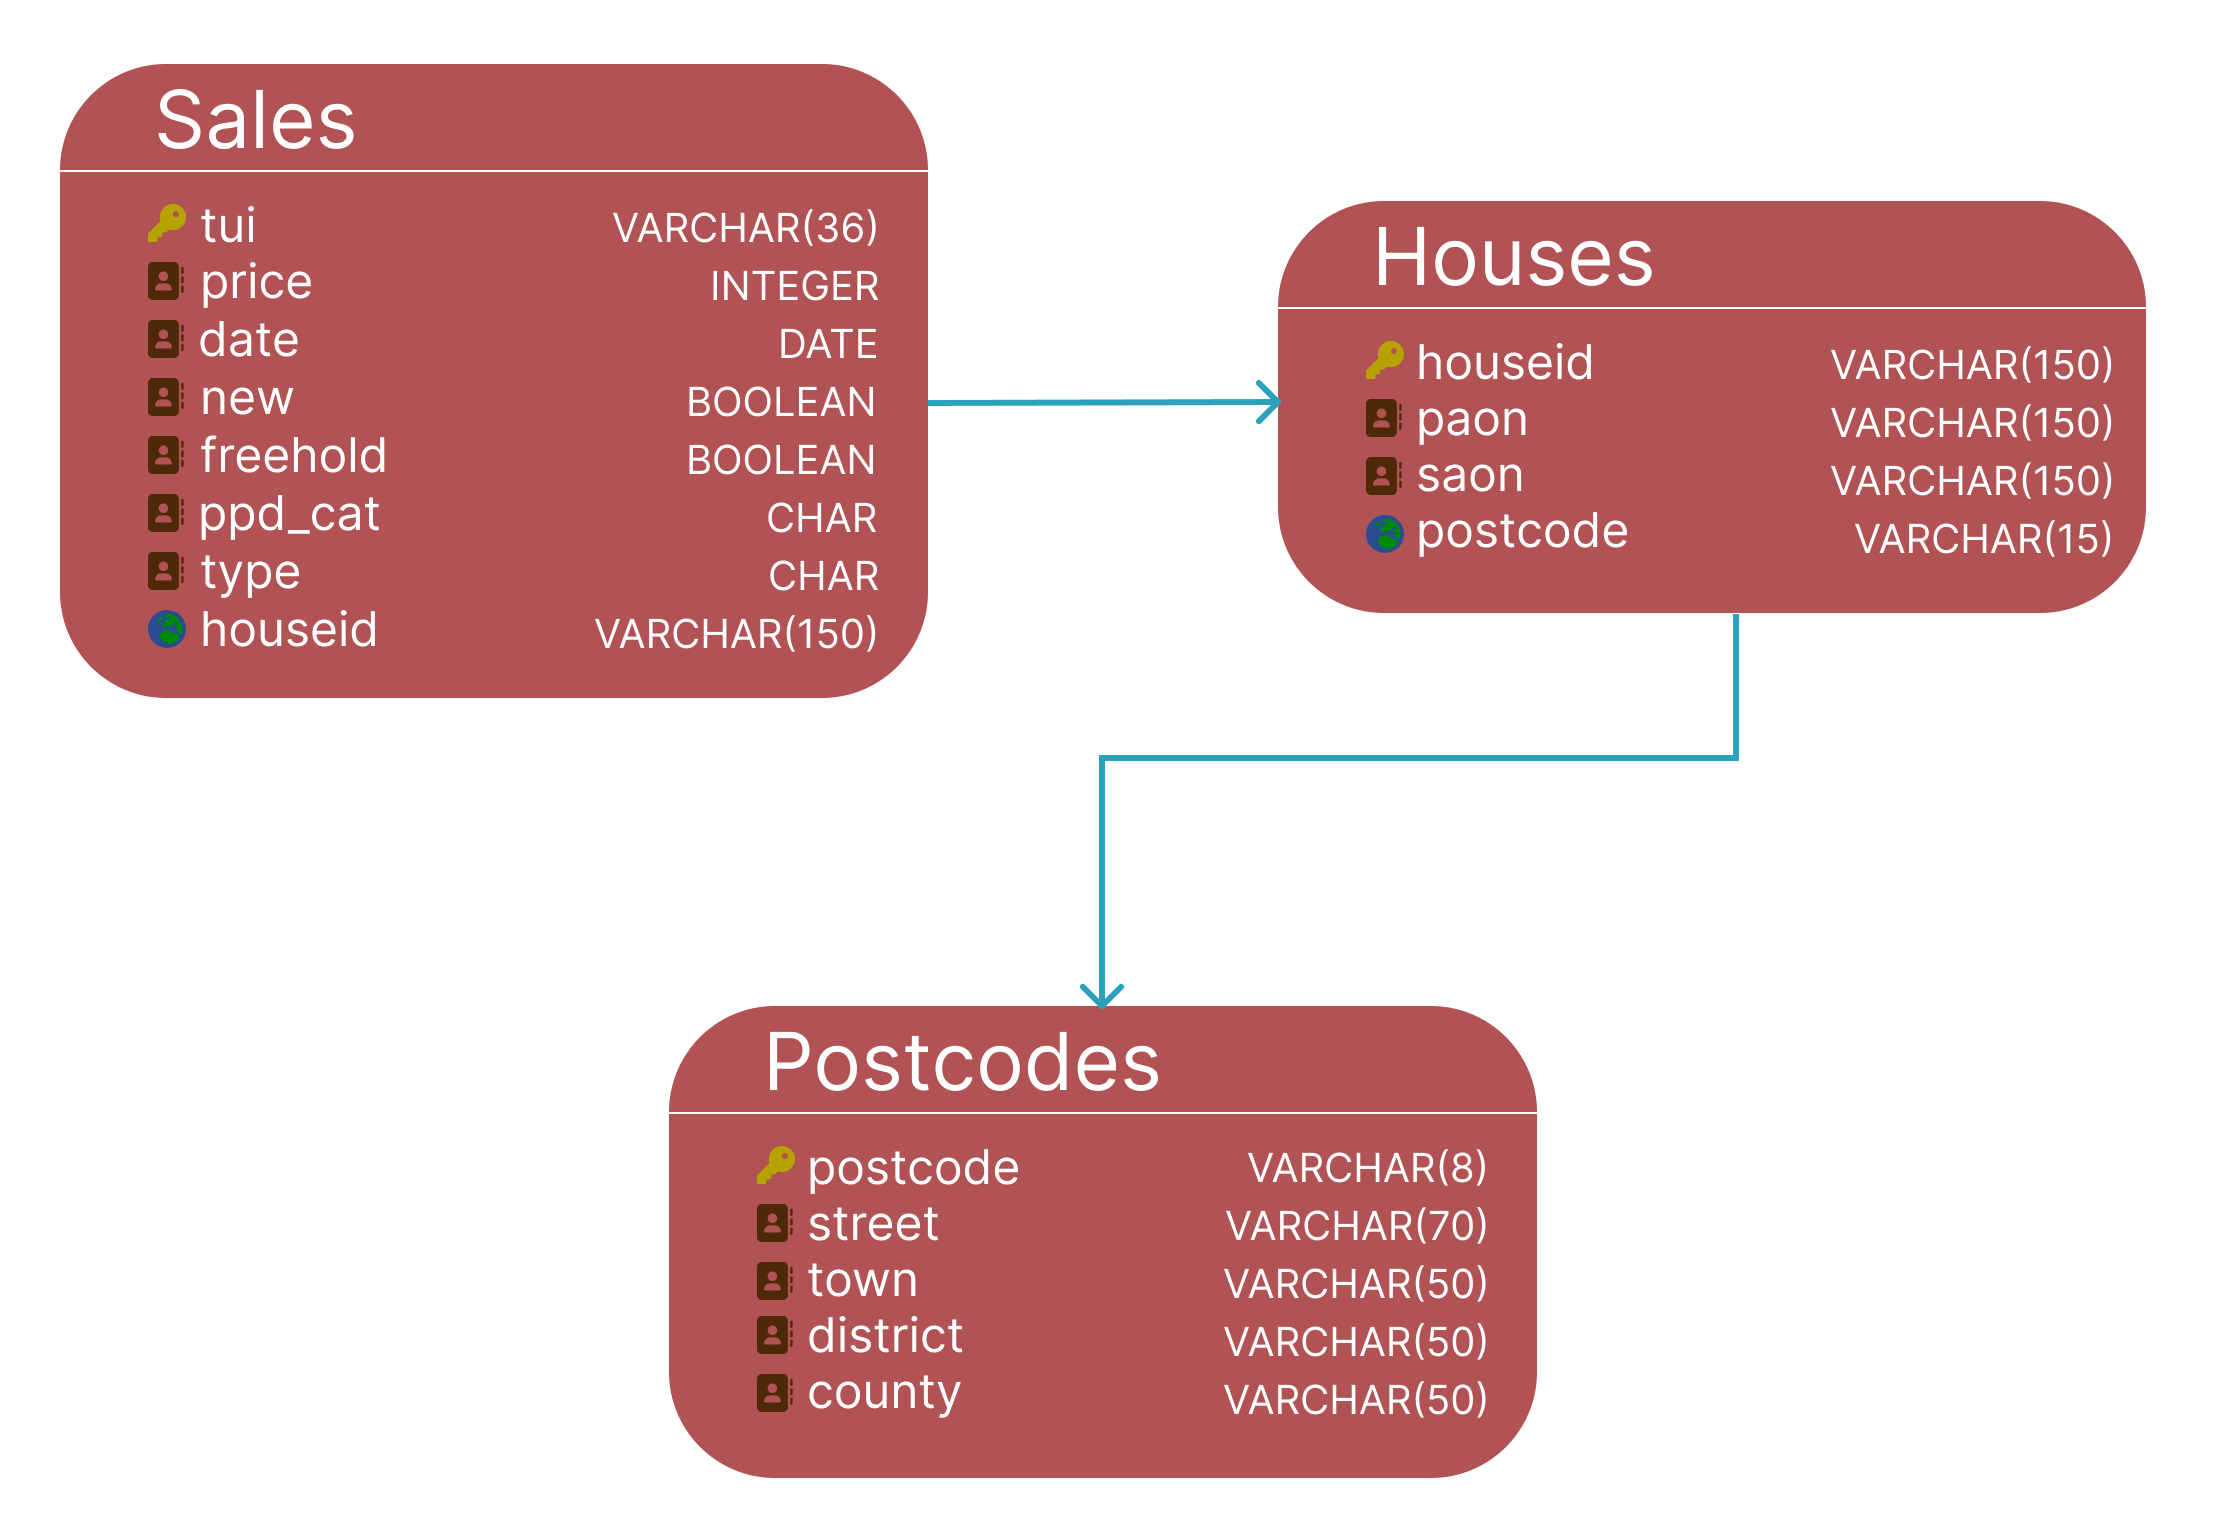
2. Data Storage and Caching
- Data is normalised into third normal form to eliminate duplication and improve query efficiency.
- PostgreSQL handles relational integrity while Redis provides an in-memory cache for frequent queries.
- Full-text indexes and partial postcode searching enable sub-second lookups across millions of records.
3. Data Processing
- Analytical workloads (standard deviation, outlier removal, and percentage change analysis) are executed using PolaRS a Rust drop-in for Pandas
- The system automatically scales to use multiple workers, allowing for batch processing of many areas simultaneously
- Results are cached in a MongoDB instance to allow for instant fetching of large areas that can take a few minutes to
process

4. Web Interface
- A Flask API serves data to a Svelte + Chart.js front-end for highly interactive visualisations.
- Users can search by town, postcode, or county; view price trends over time; and compare regions side-by-side.
- Uses write ahead search capability to help users find the area they are looking for
- Change time period interval to look at 1mo, 3mo, 6mo ,1yr
Design Philosophy
I wanted House Stats to make large-scale data accessible to everyone—from first-time buyers to professional surveyors.
- Speed: Sub-second queries are crucial for a seamless UX.
- Clarity: Data is visualised, not buried in spreadsheets.
- Openness: Unlike commercial tools from Rightmove or Zoopla, House Stats is built for the public.
Tech Stack Highlights
| Layer | Technology | Purpose |
|---|---|---|
| Backend | Flask, PostgreSQL, Redis, Dask | Data ingestion, processing & caching |
| Frontend | Svelte, Chart.js | Dynamic UI and visualisations |
| Data Pipeline | Python, Golang | Parsing, validation, batch uploading |
| Infrastructure | Docker, Proxmox, Linux (Ubuntu) | Deployment & virtualisation |
Performance and Testing
- Inserted 26 million+ transactions at ~24 k inserts/sec.
- Results fetched in milliseconds, even across millions of rows.
- Continuous integration with GitHub Actions ensures reliability.
- Sentry handles live error logging and telemetry.
Why It Matters
Large real-estate companies already exploit these datasets with proprietary software—but individuals don’t have that luxury. House Stats bridges that gap, offering open access to national-scale housing analytics. It’s a blend of distributed computing, web development, and data science, packaged into a single cohesive system.
Final Thoughts
What started as an A-level project ended up teaching me full-stack architecture, deployment, and large-scale data engineering. It was the project that led gave me an interest in large scale data analysis and building big systems.
Read the writeup I submitted and got 67/70 for Writeup
Also here is all the code from it GitHub